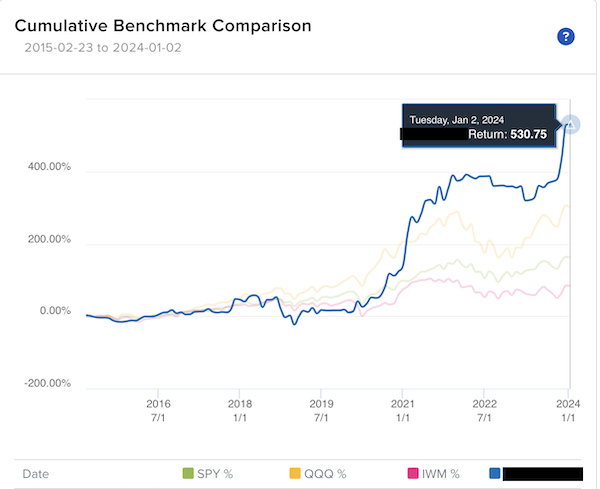
I can't believe it's been more than seven years since I did one of these posts. So I guess it's time for another. I want to share what I’ve learned from my 2023 trading but first I’d want to zoom out to a longer term view. Here’s a chart of my trading account’s returns since I moved to Interactive Brokers in 2015: all_time_return_w_bubble.png84.22 KB
Here’s the same info so you can see the benchmark indices’ returns:
My Account - 531%
SPY - 161%
QQQ - 295%
IWM - 79%
Note that my results would likely be much higher if not for the fact that I’ve continually taken money out of my account. I quit my software development job in October 2016 in order to focus on building SwingTradeBot and trading. At the time SwingTradeBot was only generating about $1,000 per month so I relied on trading profits to cover my living expenses. Here’s a short timeline of how things progressed (below I’m talking about revenue, not profit. So that’s excluding taxes and operating expenses..):
By November of 2017 STB was generating (ads & subscriptions) enough to cover my mortgage
By March of 2019 STB could cover about 90% of my living expenses
By April of 2020 STB was consistently generating about 75% of my previous salary & covering all of my living expenses
By January of 2021 (peak of the pandemic trading bubble) STB was generating about double my old salary.
As of now it’s slowly drifted back to generating about 20% more than my old salary.
So that explains why I’ve taken money out of my trading account over the years. There were also a couple of times that I withdrew big chunks of money — more than 50% — because I wanted to put the money to work elsewhere, like paying off my mortgage.
Had I kept all profits in the account and kept my position sizing the same (I typically risk 1% of my account equity per trade & use the percent risk position sizing model. ) the percentage gains would be much more than they are. So the comparison against the indices, which never have such withdrawals, isn’t an apples to oranges comparison.
On to the 2023 results. Here’s my account’s performance:
And 2023 with the benchmark indices (my account is the blue line):
So I played catch up to beat the S&P 500 and Russell 2000 but underperformed the Nasdaq 100 (really the Magnificent 7 but I won’t go down that rabbit hole)
Some key points from my 2023:
There are a few periods of flat-lining. Those are times when I just wasn’t feeling the market and/or I was on vacation
The big drop in Q1 was due to me stubbornly fighting the regional bank selloff. Pulling my stops on just 2 trades helped to push my return down to around a 9% loss.
I’m glad I was able to recognize that the environment was better suited to my trading style in October.
On the last point, I’m always telling people that you've got to stay prepared for when the market shifts to suit your trading system / style. That’s why it’s so important to keep building & pruning watchlists, even when the market sucks.
I’d also like to explain the “not feeling the market” part. It’s been a weird few years for me. If you look at the all-time chart at the top of the page you’ll see a lack of activity starting about September of 2021. That’s because I took a really long vacation. I went on a 4 month road trip around the country & didn’t trade much because I was often in the middle of nowhere or just had more interesting things to do. Not to mention that was a tough market. I've never liked markets driven by news / external events. In this case we had a war and interest rates as the dog wagging its stock market tail.
I returned home to Atlanta in February 2022 & tried to get back into my old routine. But about a month later my mother fell ill and then passed away. That required me to shift my focus to settling my parents’ estate. That process — probate & trying to sell a house in a frozen real estate market — basically took up the rest of 2022.
So I tried to reset in January 2023. By this time I’d gotten out of my habit of journaling and my normal market prep. After suffering the regional banking related losses I decided to get back to journaling. So here’s a look at some stuff from my journal.
First up are some highlights from my journal’s equity graph. Note that graph shows 32% for the year vs the 37% Interactive Brokers shows. I believe the IB data is correct because they are better at taking cash withdrawals & additions into account. I also imagine that their calculations are more sophisticated and I’m certain they’ve got all the data. I wouldn’t bet my life that I’ve gotten everything entered accurately into my journal.
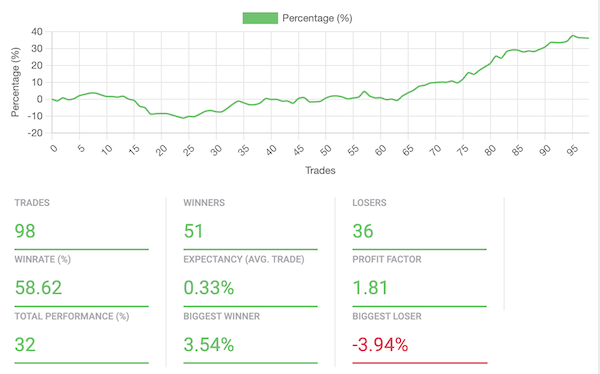
Here's the Equity Curve graph from my journal:
journal_equity_graph.png70.23 KB
Some key points:
My win rate was only 58.6%. It was 72% from October through December.
Expectancy was 33% (not 0.33% as the graph shows) & 86% for Oct-Dec
Biggest loser was way too much. I need to keep that near 1%
I want to see a much larger “biggest winner”, so I need to work on holding longer.
Proof again that one doesn’t need a high win rate to make money! I see so many people get caught up in looking for a really high win rate system. The problem is that most of the ones I’ve seen have a lot of smallish winners and a few huge losers which wipe out all of the gains from the winning trades. See “Profit vs. Win Ratio” for more on that topic.
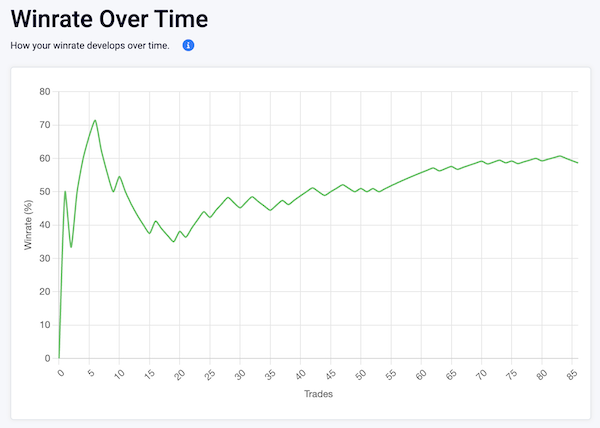
Here’s my Win rate over time:
winrate_over_time.png60.06 KB
The win rate got to a sad 35% before recovering once I cleaned up my act. However, IMHO, expectancy is the much more important metric:
"Your trading system should have a positive expectancy and you should understand what that means. The natural bias that most people have is to go for high probability systems with high reliability. We all are given this bias that you need to be right. We’re taught at school that 94 percent or better is an A and 70 or below is failure. Nothing below 70 is acceptable. Everyone is looking for high reliability entry systems, but it's expectancy that is the key. And the real key to expectancy is how you get out of the markets not how you get in. How you take profits and how you get out of a bad position to protect your assets. The expectancy is really the amount you’ll make on the average per dollar risked. If you have a methodology that makes you 50 cents or better per dollar risked, that’s superb. Most people don’t. That means if you risk $1,000 that you’ll make on the average $500 for every trade – that’s averaging winners and losers together." Dr. Van Tharp
If you haven’t read any of Dr. Tharp’s books, do yourself a huge favor and do so. I mention a couple on my recommended books page. His insights into position sizing and expectancy are critical to understand.
As for my expectancy, I’d like to keep it at .86 or higher. Here’s what that would mean, assuming I have a $100,000 account & I’m risking $1,000 per trade: (100 trades x $1000 risk per trade x 0.86 expectancy = $86,000 profit) But given my position sizing methodology I’d be risking 1% of my equity per trade not a constant $1,000. For example, once the account reached $150,000 my monetary risk per trade would be $1,500 and my position sizes would be 50% larger than when the account was $100,000. So the actual monetary gain would be much more than $86,000.
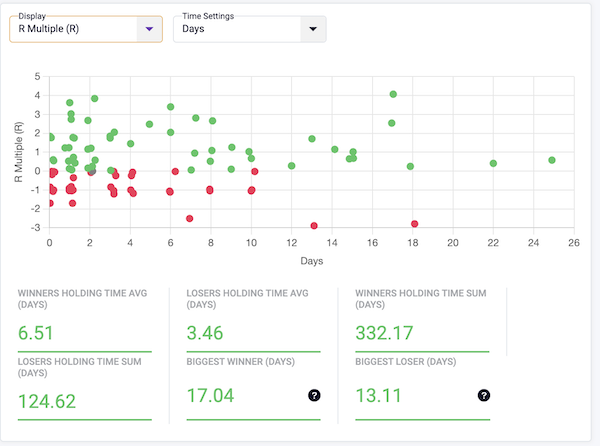
I mentioned holding time above... here’s a graph of that:
journal_holding_time.png87.49 KB
I am glad to see that my average holding time for winners was about twice what it was for losers. Noneteless, my initial takeaway from this is "too many quick profits"! But in my defense, that’s partly due to how choppy the market was before October. It was a “stick & move” environment and it was tough to immediately switch my mindset to start holding longer. Nonetheless, I really need to work on holding winners longer. I'd really like to see more green dots in the upper right quadrant of that chart. And I can’t be too upset about the 3 and 4R profits in a day or 2. Those often come from unsustainable moves and are practically windfall profits.
On the flip side, sometimes I'm holding something that's just treading water & I see a good looking setup in another stock. If I'm already loaded up with positions I'll often opt to bail out of the stalled position... but maybe I should halve the old position instead of selling outright... There's some gray area here for sure…
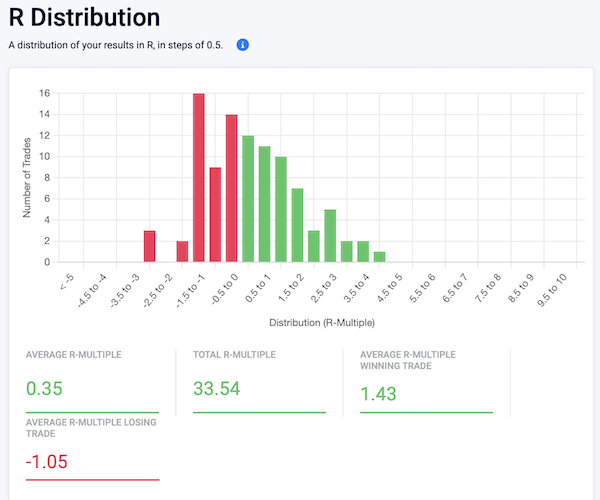
Here’s a view of my trades based on their returns in R Multiples: journal_R_distribution.png81.9 KB
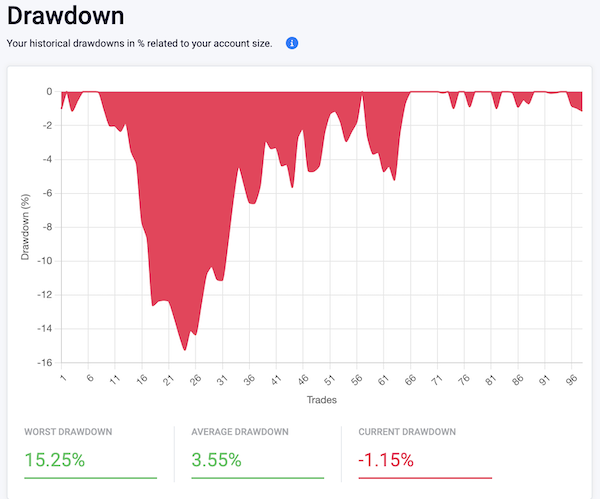
As with the previous graph, I don't want to see any red beyond the -1 to -1.5 bar and I need to see more green bars beyond 4R. I find it interesting that the graph looks like an even amount of green and red but in actuality all the "small stuff" between -1.5 and 1.5 cancel out and the 2R+ trades really add up... In this case to 33.54 R (a 37% gain) Journal_drawdown.png81.33 KB
I'd like to keep the max drawdown under 5%. That was I’m always within striking distance of new high ground.
Which Signals are the Best?
That’s a question I get asked a lot (which is why it’s in the FAQ) There is no one size fits all answer to that as I've written about. It will vary by individual, so it's best to try some out and/or backtest them to see which work best for you.
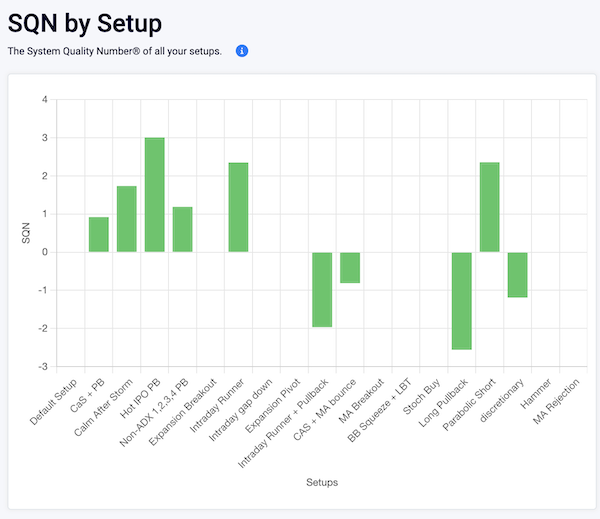
I'm most comfortable trading pullbacks in established trends, so my choice of entry signals is seriously skewed that way. Here’s a look at all the signals I’ve taken scored by their System Quality Number
journal_SQN.png73.24 KB
And here’s what those SQN scores mean:
< 1.5: Probably Very Hard To Trade.
1.51 to 2.0: Average System (Should Be At Least 1.7).
2.01 to 3.00: Good System.
3.01 to 5.00: Excellent System.
5.01 to 7.00: Superb System (Few Exist).
7.01 Or Higher: Holy Grail System.
Disclaimer — again, my results will not be your results. We’ll make a ton of different decisions. Traders need to figure out what works best for their own trading style / system.
This was very enlightening to me to see what I thought were my best setups and those which actually proved to be the best. Some of my favorite setups to see when running scans are those which appear on a Combo Scan of Calm After Storm and a Non-ADX 1,2,3,4 Pullback. That's on the graph as "CAS + PB)". That combo only scored 0.92 while "Calm After Storm" on its own gave me a SQN of 1.74 (in fairness, I always choose Calm After Storms on charts showing a pullback but those pullbacks don't always meet the definition of the Non-ADX setup) Nonetheless, that makes me feel better for always running the CAS scan on its own and not just running the Combo Scan. If I only ran the Combo Scan I'd have missed some good trades.
Hot IPO Pullback had the best SQN for me, coming in at 3.01. That's not a surprise to me because it's also one of my must-run scans. What is surprising is that in a year with so few IPOs it still performed well. In 2023 I took 6 Hot IPO Pullback trades with a 100% win rate! I'm looking forward to a market environment where we have more IPOs!
Intraday Runner scored 2.35 - 5 winners, 1 loser -- these are things I notice from watching my intraday alerts and/or my broker's percent movers list during the day. I usually enter these on an opening range breakout .
Parabolic short scored 2.36 -- 6 winners, 3 losers & 1 break-even. These are some of my favorite trades -- carefully picking spots to short stocks which have gone parabolic. One annoying this is that I often don't trade these because they're hard (and/or too expensive) to borrow.
Intraday Runner + Pullback scored -1.97 - 2 losers & 1 break-even trade. Similar to the Intraday Runner but these pulled back to some support level and tried to bounce. I probably need to stop taking these!
Long pullback was the worst at -2.56 - 4 losers & 1 winner -- these usually started as a Non-ADX 1,2,3,4 Pullback but didn't trigger an entry right away. I'll often keep these on my watchlists & will see what looks like an entry show up a few days after the Non-ADX appeared... I guess I should stop tracking these!
Discretionary scored -1.19 - 2 winners, 5 losers & 1 break-even -- I tagged the foolish bottom fishing trades from March as well as some other things I did off the cuff... definitely need to cut these out & just stick to the defined setups! If not, at the very least I need to adhere to my initial 1R stop loss orders!
There are a total of 19 setups on the graph, which represent all the trades I made in 2023. Many are blank because I only took those setups once. I'd like to take more of those setups to see how they perform across a decent sample size.
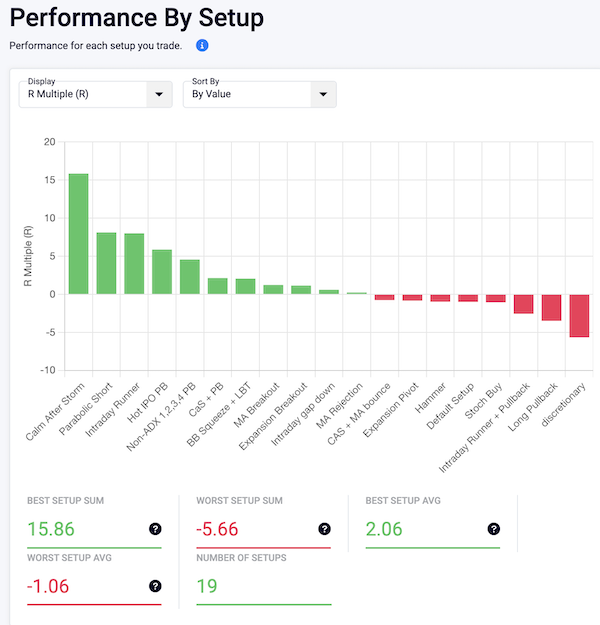
performance_by_setup.png104.78 KB
That’s a different view of each setup which makes it clear where my money was made & lost. The best average setup was "Bollinger Band Squeeze plus Lower Band Touch" but I only took one such trade. So I'll be looking for more of those to test if it can perform like that after several trades. As I mentioned above, I really need to "get more reps" on all the setups where I only took 1 or 2 trades.
General Takeaways
The bottom line is I need to do more of what's working & cut out what's not! No pulling stops and fewer trades without a pre-defined setup.
What doesn't show here is missed trades. (I wrote about my missing trades issue in my 2016 post... I guess I slipped back into an old bad habit.) There were several times mid-year where I'd put a setup on my "Ready for Entry" watchlist but neglected to actually put in my order. I'd be annoyed when I'd watch the stock run past my entry point and take off without me. Then I wouldn't want to get in because I'd feel like I was chasing & I missed the optimal entry. I must have texted my trading buddy Duru "there goes XYZ without me 😢 " a couple of dozen times.
So one of the things I did later in the year is to make sure I get my orders in at least 30 minutes before the market opens. That really helped me to catch some good trades in November and December.