Why SwingTradeBot's ADX Values May Differ from Those of Some other Financial Sites
A few days ago someone emailed me asking why two stocks were appearing on the Boomer Buy Setup scan. That signal requires ADX to be over 30 and he was seeing ADX values under 30 on other platforms (ThinkOrSwim).
The email continued with:
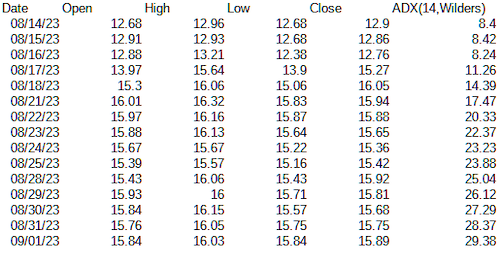
According to thinkorswim source code ADX for LYTS it not more than 30. Let's take the last 15 daily bars of LYTS. OHLC bars were extracted from thinkorswim and confirmed with data from IBKR. According to these, the calculation of ADX(14, Wilders) for day 1 of Boomer Buy Setup (30 Aug) shows that ADX is much less than 30 and thus does not pass the H&R criterion requirement for day 1:
email_ADX_image1.png120.95 KB Also, the ADX value shown on SwingTradeBot's LYTS page for Sep 1 (30.44) differs from thinkorswim ADX value (29.38).
How did swingtradebot find ADX more than 30 for Aug 30 and why does ADX differ for Sep 1?
My response was:
Next week, when I'm back from vacation, I'll have to dig into my code to see what's going on. But I just checked StockCharts.com & they have its ADX at 29.94 (while TradingView has it as 29.38). My numbers are usually the same as or close to theirs because they adjust their data for dividends (as does SwingTradeBot). Most of the other charting services do not -- something I wrote about here https://swingtradebot.com/topics/11422-beware-of-charts-which-have-not-been-adjusted-for-dividends
I'll let you know what I find out.
So I've spent several hours yesterday and today going through my code and here's what I found...
I have tests for just about every value that SwingTradeBot calculates. In almost all cases those tests state "expect value X to equal Y". But in the case of the ADX values my tests are like: "expect ADX to be within 0.75 of 28.41" and then there's a comment stating that "stockcharts.com has this as 28.41"
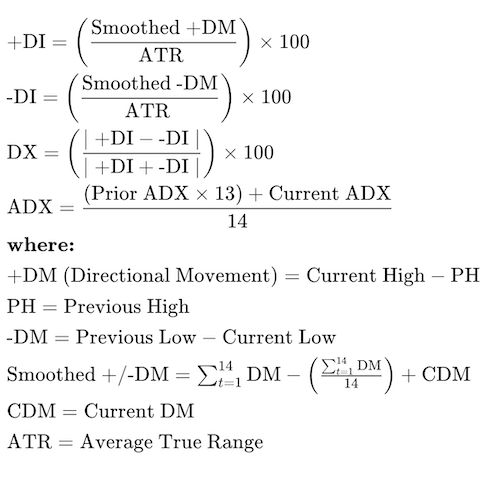
That reminded me that when I wrote the ADX calculations years ago I couldn't get my values to exactly match what I was seeing elsewhere. I believe that's because my tests were not using enough days of data to get reliable ADX values. ADX has a pretty involved formula with lots of data smoothing. Here's the formula:
Above is a spreadsheet example with all the calculations involved. There is a 119-day calculation gap because approximately 150 periods are required to absorb the smoothing techniques. ADX/DMI enthusiasts can click here to download this spreadsheet and see the gory details.
It's important to understand the effects of all the smoothing involved in the ADX, +DI and -DI calculations. Because of Wilder's smoothing techniques, it can take around 150 periods of data to get true ADX values. Wilder uses similar smoothing techniques with his RSI and Average True Range calculations. ADX values using only 30 periods of historical data will not match ADX values using 150 periods of historical data. ADX values with 150 days or more of data will remain consistent
So I decided to beef up my tests and test all the interim values in the ADX formula and see if I could get my calculations to match what's in the spreadsheet StockCharts has available to download. Over the last two days here's what I found:
I had a couple of errors / misinterpretations in my code. I was generating an erroneous value for day 1 of a stock's True Range. I'm now properly setting that value to zero. In my Directional Movement Index (DX) code I forgot to take the absolute value of a calculation, so in some cases the value was negative instead of positive.
After making those changes my code was producing values exactly matching the source spreadsheet! (as mentioned above, those values weren't consistently equivalent until right around day 150)
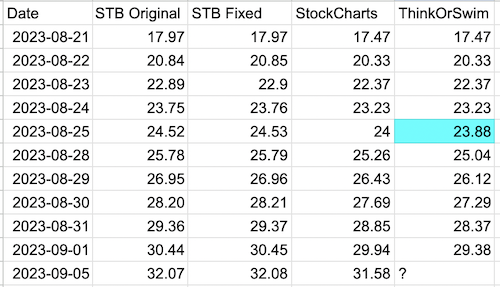
I regenerated the data for the original stock in question (LYTS) and those values still don't match the values of StockCharts or ThinkOrSwim.
Here are the LYTS ADX values:
LYTS_ADX_Values.png113.91 KB
My thoughts on the above data:
My changes to the calculations didn't have a significant impact on the final ADX values.
I find it curious (to say the least!) that my algorithm matches StockCharts' ADX spreadsheet but it doesn't match what StockCharts' actual system produces. It seems that they're using a different methodology in their system***
StockCharts' and Think or Swim's values were the same until August 25, which is the day LYTS went ex-dividend!
25, by definition, is the level of interest for ADX because Wilder decided that was the threshold for a strong trend.
The setups from Hit & Run Trading (like the Boomer Buy) tend to use a 30 ADX value. Via that lens SwingTradeBot's data only differed by one day -- and in this case it alerts you a day earlier than the other sites' data.
(*** My theory on these differences is that StockCharts is rounding values off and/or truncating numbers with a lot of decimal places. When I first started trying to match the spreadsheet some of my values were way off for no apparent reason. Then I realized that while the spreadsheet was displaying 2 decimal places the actual values in the cells had a precision of 4 decimal places. Once I re-exported the data with all the decimal places intact my data started matching up.
Let's take 5/0.017 vs 5/0.02. the first result is 294.11 while the second is 250! My code leaves all those decimal places as they are but if an algorithm rounds 0.017 up to 0.02 then the results will be wildly different!)
Again from StockCharts' ADX article:
At its most basic, the Average Directional Index (ADX) can be used to determine if a security is trending or not. This determination helps traders choose between a trend-following system or a non-trend-following system. Wilder suggests that a strong trend is present when ADX is above 25 and no trend is present when ADX is below 20. There appears to be a gray zone between 20 and 25. As noted above, chartists may need to adjust the settings to increase sensitivity and signals. ADX also has a fair amount of lag because of all the smoothing techniques. Many technical analysts use 20 as the key level for ADX.
If you take that into account it's interesting to note that all of the various calculations crossed above 20 on the same day. They also all crossed 25 on the same day a few days later.
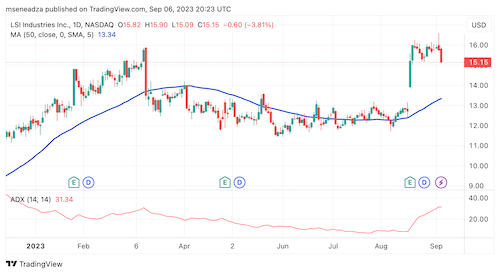
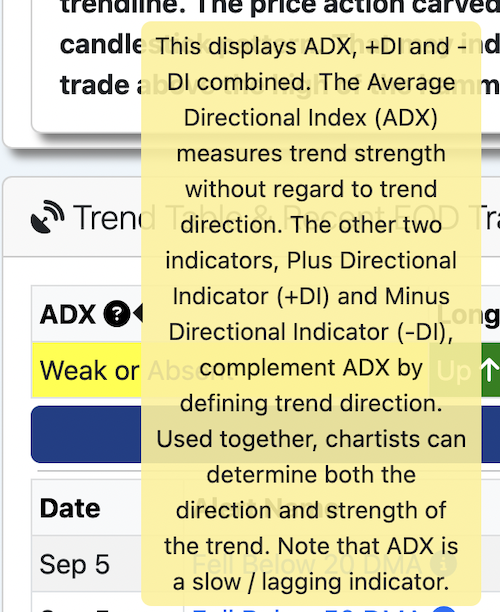
On a more general note, I'll reiterate that ADX is a lagging indicator. If you look at the chart, you can see that it actually started trending up on August 17th, when it gapped up after reporting earnings. ADX doesn't show that until 6 days later when it crossed 25 and it took several more days to cross 30 LYTS_2023-09-06_16-23-20.png70.44 KB While ADX can be useful, one has to recognize that it's a derivative of a derivative of a derivative -- thus its lagginess. That's why I've had this little note on the site since practically day 1:
ADX_lagging_note.png467.72 KB My takeaways from all of this:
Over the years I've come to realize that there's sometimes no "truth" in stock market data. One place may adjust for dividends, one data provider may set their closing price right at 4 PM while another may take the 4:15 price, or there may be slightly different algorithms being used for an indicator.
It can be counter-productive to be too precise. I see this on SwingTradeBot when people get too caught up in looking for a precise letter grade (I discussed this a bit in the comments here). I've also seen it with people placing limit orders that don't get filled & then they miss a huge move because they weren't willing to just pay up a few cents.
While I'm still a little curious about why my numbers don't match StockChart's live data, I'm very satisfied that my code produces values that exactly match their ADX spreadsheet. I don't think it's worth spending any more time on tweaking the code because what it produces is "accuate enough"
C
Cape
5 months
ago
Excellent article. Would be interesting to understand about this smoothing over 150 days as it makes ADX into possibly too much of a lagging indicator for a trader.
Plus, I see similar smoothing is used in the average true range. This links to the Chandelier which I use to help on stop loss functioning.
Could shorter smoothing periods with use of exponential weighting make the ADX and these other indicators more suitable for traders?
Also, the code must be correct of course and differences with other results purporting to present the same data need to be understood. But also, do the results match up to actual data - is any back testing run to find and explore any gaps between expected and actual data?
They're essentially the same except that one requires ADX to be in the trending zone and one (the Non-ADX...) doesn't take ADX into account at all. I always use the Non-ADX version because it finds more candidates. Then I'll just judge for myself, by looking at the chart, whether they're trending enough for my liking.
I'm not sure you can make ADX considerably less laggy. Here's an article exploring what the *best* settings are - https://therobusttrader.com/adx-indicator-settings-best/ As for the Chandelier Exit, you can certainly make it faster by using fewer ATRs but that will also cause more whipsaws... just like a shorter/faster moving average will vs. a longer/slower MA.
Most non-oscillator indicators are laggy. That's why there's a contingent of traders who just say use pure price. Here's an article about leading and lagging indicators - https://www.earn2trade.com/blog/leading-and-lagging-indicators/ . It says the popular leading ones are:
Stochastic oscillator
Key support and resistance levels
Fibonacci retracements
Donchian channels
Relative Strength Index (RSI)
Williams %R
and gives these as examples of lagging ones:
Moving Averages
Bollinger Bands
Moving Average Convergence Divergence (MACD)
Supertrend
Parabolic Stop and Reverse (Parabolic SAR)
I think it's up to each trader to figure out what mix & settings work for their trading style & market cycles.