New Scan: Stocks Making a Three-Weeks-Tight Pattern
February 06, 2017
I just added a scan to find stocks making a 3-Weeks-Tight pattern. This is a pattern that Investor's Business Daily / William O'Neil likes a lot. As they describe it:
The three-weeks-tight is exactly what the name suggests: three weekly price closes nearly unchanged from each other. Each close should not differ by more than 1.5% from the prior week, although within 1% would be ideal.
Beware the three-weeks-tight with no significant prior uptrend. Also beware the three-weeks-tight on a stock that simply doesn't move very much.
Volume should cool off as the stock builds this pattern. Even better, it should be cooling from elevated levels seen as the stock scored those big post-breakout gains.
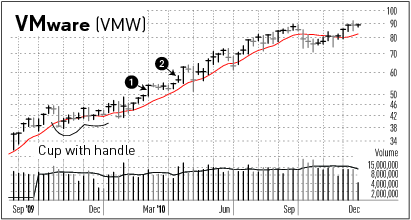
The pattern looks like what you see starting at point 1 and continuing for 3 or 4 more bars in the image below (it's actually a 4 or 5 weeks tight):
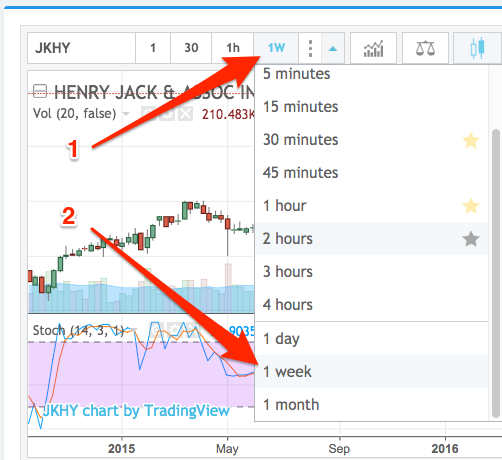
I've restricted the weekly change to 1% in order to cut down on the number of stocks making the cut. Note that this scan is different than all of the others in that it will only trigger on thge last day of the week -- typically Friday but it will show up on Thursday during a week which has a market holiday on a Friday. You may also wish to switch your chart to a weekly chart to best make out the pattern visually. The image below shows how to switch to a weekly chart:
Also note that at this time, the scan does not take volume into account. So if you want to stick strictly to IBD's rules, you'll need to check the volume yourself. I may tweak the scan in a couple of weeks if I see a good number of stocks returned by the scan which clearly should not make the list.
Recent Comments
- TraderMike on Trades of the Week: Jan 8 - Jan 12, 2024
- Magneto296 on Trades of the Week: Jan 8 - Jan 12, 2024
- SwingTradeBot on Market Recap for Tuesday, February 27, 2024
- SwingTradeBot on Market Recap for Monday, February 26, 2024
- SwingTradeBot on Market Recap for Friday, February 23, 2024
From the Blog
Blog Tags
Featured Articles