Finding and Tracking IPOs to Trade
July 15, 2016
I've been involved in the market for just over 20 years now and some of my best trades have always been in stocks which IPO'd not long before I bought them. That's because those companies (at least the good ones!) are usually very innovative, are (should be) growing quickly, have small floats and once they break to new highs there's no 'natural' overhead supply of sellers. So one of the things I wanted SwingTradeBot to help me with was tracking IPOs. I generally like to jump into IPOs in two different ways:
- as they break out to a new high
- as they pull back and reverse after a big pop on their IPO day
Investors Business Daily (IBD) / CANSLIM is also a big fan of IPOs. Here's a small sampling of what they've written about IPOs: From IPOs Can Be Risky But Profitable
The N in IBD's CAN SLIM investment system can stand for new products, new services or new management. The N also stands for new issues or initial public offerings (IPOs) that are so strong that they go on to reach new highs. Just as new toys can bring children happiness, new issues that come to market can bring investors joy. Some IPOs have gone on to become huge stock market winners.
While new issues can be volatile, they can turn out to be some of the most profitable. When a hot, new company sells shares of itself to the public, it's tempting to buy right away. But it's often prudent to wait for new issues to form an IPO base first. Many new issues tend to be quite volatile on their first few days or weeks of trading. Don't buy into the early hype, as you may get shaken out easily. Just like other stocks, an IPO needs time to go through a consolidation period. Let it digest gains and let the early enthusiasm settle down to form a base.
Here are the ways I use SwingTradeBot to track IPOs.
I Add 'Hot' IPOs to a Specific IPO Watchlist
I use one of my watchlists solely to track the IPOs I don't want to slip by me. Once an IPO gets on my radar for whatever reason, I'll add it to my IPO watchlist to ensure that I don't miss a good setup.
I use the Recent IPO page
I make sure to check this page every day. By default it's sorted by the number of days the stocks have been trading, so the most recent IPOs are at the top. So that default sorting is useful for notifying me about new IPOs. Note that, like most of the tables on the site, that table can be sorted by other columns simply by clicking on the column header. So here's a sort I often do -- sorted by 'percent from a new high': 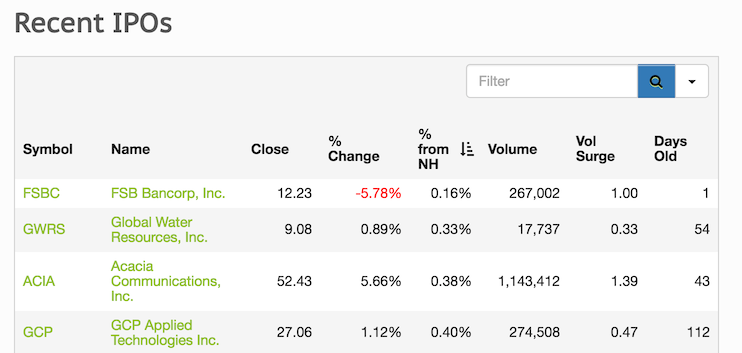
That allows me to quickly see which stocks are possibly on the verge of a breakout from a base. After sorting I'll do two things:
- Look at how many days its been trading. If it's only been trading a few days then it hasn't had a chance to base and I won't be that interested in trading it the next day. I may add it to my watchlist though.
- Use the hover charts to get a quick feel for the pattern(s) the stock is building. When I see a pattern that I like I'll open that stock in a new browser tab and then decide what to do with it (enter an order, add to watchlist or do nothing) after a bit more examination of the chart & company.
Other useful / interesting sorts for that table are by volume surge and percent change for the day. Both of those sorts can surface stocks which had some important news and may be starting a big move.
Another thing I'll do on that recent IPO page is sort the 'recent events' table by event. Then I'll go through the table and look at stocks which had specific events for that day. 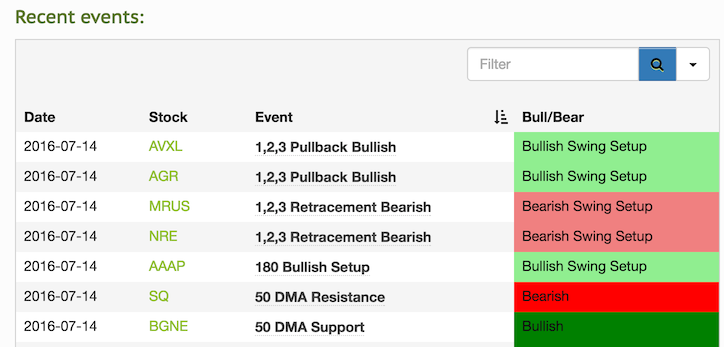
I'm usually most interested in:
- 1,2,3 Pullback Bullish - trending up and retracing / resting
- Bollinger Band Squeeze - consolidating / range contraction
- Calm After Storm - range contraction
- Expansion Breakout - range expansion
- Hot IPO Pullback - an IPO which did well in its first days of trading and is now resting / retracing
- New 52 Week High - new all-time high in the case of these newly listed stocks
- Non-ADX 1,2,3,4 Bullish - similar to '1,2,3 Pullback Bullish' but without the ADX indicator requirement (since ADX is a lagging indicator, these young stocks may be trending but their ADX may not register that fact)
- Volume Surge - not very useful for the very new stocks b/c the first day's volume skews the average
- Wide Range Bar - range expansion
Here's an example of a trade I took last year in SHOP, which is also an example of why I like range contraction setups. It had a big gain on its first day of trading and then pulled back and fell into a tight trading range. It triggered a Hot IPO Pullback on May 28th, 2015. So it was solidly on my radar. I remember entering "good for day" orders just above the high price of the 28th a few days in a row which never triggered. Then I just decided to put in a "good until canceled" order above the blue line on the chart. Once it finally triggered (I was on vacation when it did) it ran about 50% higher in seven days.

I Check the 'Hot IPO Pullback' Scan Results
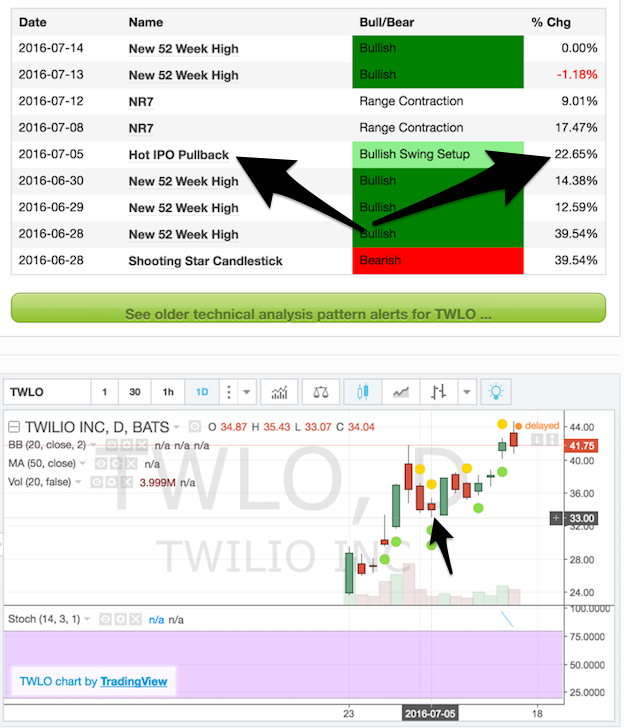
The other place to find IPOs is the Hot IPO Pullback scan page. That will highlight stocks which traded at least 15% above their offering price within the first five days of trading and then had a two - to - four day pullback. That could be any combination of lower lows, lower closes, inside days, etc. That is one of my favorite scans! I just took a trade in TWLO last week based on its Hot IPO Pullback setup. Are you can see below, it's risen over 22% in the seven days since that alert:
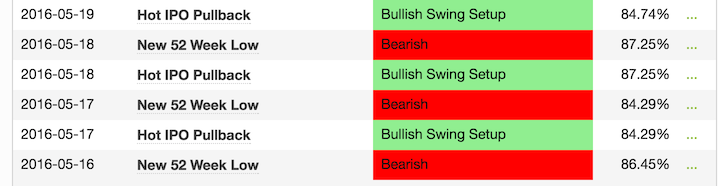
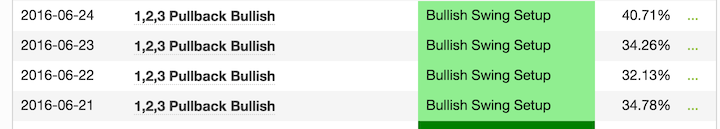
Another great example is ACIA, which showed up on the Hot IPO Pullback scan 3 days in a row immediately after its first day of trading and then, about a month later it had 4 days in a row of '1,2,3 Pullback Bullish' alerts. It's currently up about 85% from those Hot IPO Pullback events and 40% from the 1,2,3 Pullback events.
There you have it -- a few ways to use this site to find good IPO candidates to trade. I hope you find some good trades with these tools.
Popular Now
Recent Comments
- TraderMike on Trades of the Week: Jan 8 - Jan 12, 2024
- Magneto296 on Trades of the Week: Jan 8 - Jan 12, 2024
- SwingTradeBot on Market Recap for Tuesday, February 27, 2024
- SwingTradeBot on Market Recap for Monday, February 26, 2024
- SwingTradeBot on Market Recap for Friday, February 23, 2024
From the Blog
Blog Tags
Featured Articles