New Addition: Stats on the Daily Scan Results
August 08, 2017
I recently added some data which may be helpful in getting a feel for what scans are "trending". I've started tracking the number of stocks which appear on each scan each day. That's enabled the ability to show how much above or below normal a scan is on any given day. You can find this data in two places.
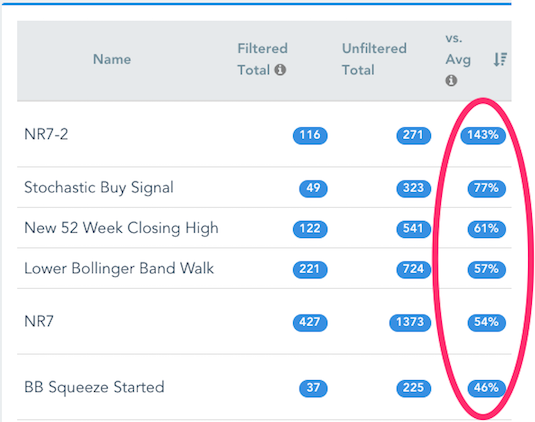
The first place to find this data is on the All Scans Page in the "vs. Avg" column. You can sort the table by that column in order to see which stocks are "hot" or "cold" for that day. So the screenshot below shows that there was an above normal amount of range contraction (NR7, NR7-2 and Bollinger Band Squeezes starting), some oversold stocks perking up (Stochastic Buy Signals), a lot of new 52-week closing highs and an abnormal number of stocks walking down their Lower Bollinger Bands (probably reactions to disappointing earnings) for that day.
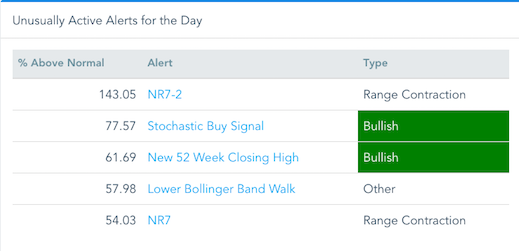
A subset of that data is also available on the General Market Overview / Recap page. The five scans with the highest percentage change above normal are listed there.
This data should be helpful to get a quick feel for what's going on under the market's surface and, more important, some guidance on where to look for trading opportunities on any given day.
Recent Comments
- TraderMike on Trades of the Week: Jan 8 - Jan 12, 2024
- Magneto296 on Trades of the Week: Jan 8 - Jan 12, 2024
- SwingTradeBot on Market Recap for Tuesday, February 27, 2024
- SwingTradeBot on Market Recap for Monday, February 26, 2024
- SwingTradeBot on Market Recap for Friday, February 23, 2024
From the Blog
Blog Tags
Featured Articles