Lessons Learned From My 2016 YTD Trading Results
October 01, 2016
I thought I'd share some thoughts I had while reviewing my trading results so far this year. Through today, the end of September 2016, the Nasdaq is up 6.08%, and the S&P is up 7.09% while my swing trading account is up 33.09%. While I'm happy to be outpacing the market by 4.5x, I'm a little disappointed that my account isn't up even more. That's because I know I missed a few trades that could have easily doubled or tripled my gains from where they are now. Nonetheless, I feel good that I've mostly stuck to my rules and that I'm still trading with a positive expectancy. Let's take a more detailed look.
Equity Curve
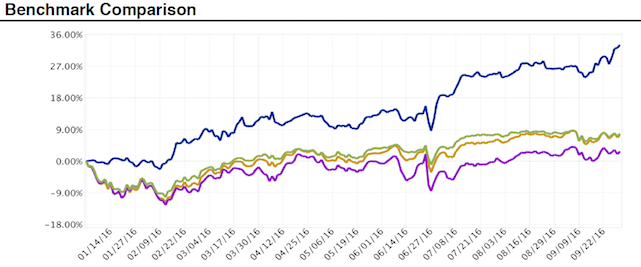
The dark blue line in chart above is my account and the green line is the S&P 500. What stands out to me when viewing my equity curve is that it's been a pretty orderly rise punctuated by some choppy, sideways action -- and then there was Brexit on June 27th. The primary reason for the sideways periods is that the market itself was chopping around and I try to do less when the market is not trending up or down.
I credit the lack of significant drawdowns to me not trying to fight the primary trend. As much as I love to short stocks that's been a very tough thing to do as a swing trader this year. Drawdowns were also kept minimal by the fact that for the most part I adhered to my stop loss orders. (See my earlier post about how all of my entry orders have stop loss orders attached.)
The one time I did pull my stops was during the Brexit aftermath. My account had just eked out a new high hours before the Brexit vote was completed. As we know, the results of that vote shook the financial markets and the US market gapped down significantly the next morning.
I was close to 100% long at that time. Luckily I had pretty good gains in my stocks, so I decided to cancel (pull) all my stop loss orders. I figured that the market was having one of its famous overreactions. I took some heat for a couple of days but then saw signs of a reversal. It seemed to me that the selloff was a buying opportunity so I started looking for stocks which were at support levels. I picked up some ZEN shares on June 29th (It was on one of my watchlists and I saw that on the 28th it made a Calm After Storm and climbed back above its 50-day moving average) Sure enough, the market turned and rocketed higher a couple of days later. That bounce actually propelled my account well beyond where it was before the vote. So I switched from wishing I'd sold or hedged before the vote to being quite happy with my decision to pull my stops and not try to hedge. I try not to make a habit of pulling stops but I've learned that some of these big ugly gap-down days on questionable news just seems to be "the market" trying to shake out the weak holders (trolling for stops).
Distribution of Trades & Winning Percentage
This is the interesting part to me. People are always attracted to systems with high win rates but I've always subscribed to the belief that one does not need a high win rate in order to make money. (In fact, I've read that the ideal win rate is between 50 and 70%.) Sure, it feels good to be proven correct a lot but a high win rate doesn't necessarily mean a system is profitable. It might mean that a lot of small profits are taken (booked) and that the system/trader is holding on to big losers waiting/hoping for them to turn around. And while clinging to those losers, you're missing out on other winning trades because your cash is tied up in those losers.
I'm a believer in finding setups that allow me to define a price where I'm proven wrong with a small, manageable loss. I know that if I stay disciplined and take my losses as planned that in the end the numbers will work out in my favor because I'll have a few huge winners to offset the small losers.
So here's the breakdown of my trades so far this year. (Click the image for a larger version.) 
As you can see there are 13 trades with gains greater than my biggest losing trade. This is a good illustration of the Pareto Principle, which "states that, for many events, roughly 80% of the effects come from 20% of the causes". In other words, when applied to trading, 80% of your profits will come from 20% of your trades. Or, if you're losing money, it may be that 80% of your losses come from 20% of your trades. (And why one could have an 80% win-rate and still lose money!) In my case, 20% of my trades equals approximately 14 trades. So you can add up the 14 biggest winners from the chart and see how the Pareto Principle proved true for my account.
In fact, two positions (SHOP and ISRG) in particular have done the heavy lifting for my portfolio. I bought ISRG in late October 2015 as it was flat-lining around the $500 mark, consolidating gains from its earnings report several days earlier.

I picked up SHOP February 19th as it was making a pattern that I've liked for a long time -- that's what inspired me to create the Calm After Storm stock screen. An added bonus was that it seemed to be working on a double-bottom at that time.

I'm still holding both of those stocks today with a 44% gain in ISRG and a 112% gain in SHOP. The gains from those two trades alone severely dwarf all of my losing trades. So I could have only had those two winning trades and all the losing trades and still made money with what would have been around 95% losing trades.
My actual win rate was 45%. I think most people would not want to trade a 45% win rate system but if I told them they'd be up 33% in 9 months they might change their minds. (I did a similar analysis on my trades back in 2006 when I was day-trading full time and my win rate then was 47%. Also note the ill effects of me pulling my stops back then.)
Some notes about the losing trades, especially the ones which were close to break-even... Many of those were trades that I ended prematurely. I try not to use margin for extended periods of time, especially not over weekends. So when I get in a state where I'm using a lot of margin I'll do some selective trimming of my positions. That often means closing the losers. I've also done that when I was tired of watching something drift for days on end. Some of the small winners fall in that category as well. In some cases those stocks went on to become pretty good winners but without me along for the ride. That's frustrating but if I could do those trades over I'm not sure I'd do anything different. I think I made good risk management decisions given the information I had at the time.
Effects of Position Sizing
I should also note that position sizing has skewed my results a bit. Back when I initiated the SHOP and ISRG trades I was trading much smaller than I am today. I use the percent risk position sizing model. So I start by deciding a dollar amount I'm willing to lose (risk) per trade. When I entered SHOP and ISRG, my risk per trade was 0.5% of my account's equity. I've slowly increased that value to 0.8%. So my more recent positions have been significantly larger than SHOP and ISRG started out.
So let's assume I had a $100,000 account and SHOP presented a setup which dictated a stop loss $2 under the entry price. We'll say the entry is at $40 and the stop is at $38. The 0.5% risk level would require me to risk $500 which means I could only buy 250 shares (thereby putting $10,000 to work.) If I were risking 0.8% ($800) per trade, I could buy 400 shares ($16,000 worth). So that gives you an idea of how much larger my positions are these days. I would have had 60% more shares of both those stocks and they would have lifted my portfolio more.
While I prefer to have fewer, more concentrated positions that sometimes becomes a problem when I see setups I'd like to take but I have no spare equity. So I'm trying to nail down my ideal level of risk per trade which will allow me to get position sizes such that a good move in the stock will really be impactful to my portfolio but also allowing me to not miss too many trades because all my cash is tied up.
Wrapping Up
I was a little surprised to see that I had only taken 69 trades so far this year. But when I really look back at the charts, I think that's a good number of trades given how choppy the market has been. Those sideways markets can really generate a lot of losing trades (death by 1,000 cuts), so I'm glad I was able to show restraint during those times.
Overall I'm happy with my results so far this year. While I think it would be great to have a higher winning percentage, I'm not overly concerned with that statistic. Instead, I think my biggest problem is missing trades that I should have taken. I've pointed out a few of those in the Mike's Notes section of the site -- ACIA is probably the most glaring example. I've had that stock on my watchlist since the day of its IPO. I saw it make some of my favorite setups (It's up over 260% from the HOT IPO Pullbacks it made in mid May!) and somehow I never got in. I can rationalize reasons for not getting in -- broad market being choppy, not having free cash at the time, forgetting to look at my watchlist, forgetting to enter an order, not liking the position sizing given where I'd have to put the stop loss, etc. -- but I've got to do better at taking these trades.
P.S. The high win rate / being correct / making predictions thing is a major pet peeve of mine. It seems a day doesn't go by when somebody replies to one of the alerts the site sends out to StockTwits & Twitter saying "Ha! You're wrong...". I try my best to just ignore those people but I often think of all the things I want to explain to them. Like, none of these technical signals are predictions. They're possible setups which may or may not work. You also can't take any one signal in a vacuum. You need to incorporate them into a bigger technical picture -- Is the stock trending? What's the broader market doing? Is the stock near support or resistance? Is it about to report earnings? Did the setup actually trigger an entry? Many of the alerts the site sends out never trigger an entry but people will still just look at them and say "you were wrong". Well if I had a system that was right 100% of the time I'd be the richest person in the world. /END RANT
Popular Now
Recent Comments
- TraderMike on Trades of the Week: Jan 8 - Jan 12, 2024
- Magneto296 on Trades of the Week: Jan 8 - Jan 12, 2024
- SwingTradeBot on Market Recap for Tuesday, February 27, 2024
- SwingTradeBot on Market Recap for Monday, February 26, 2024
- SwingTradeBot on Market Recap for Friday, February 23, 2024
From the Blog
Blog Tags
Featured Articles